About Landsec
WHAT WE DO
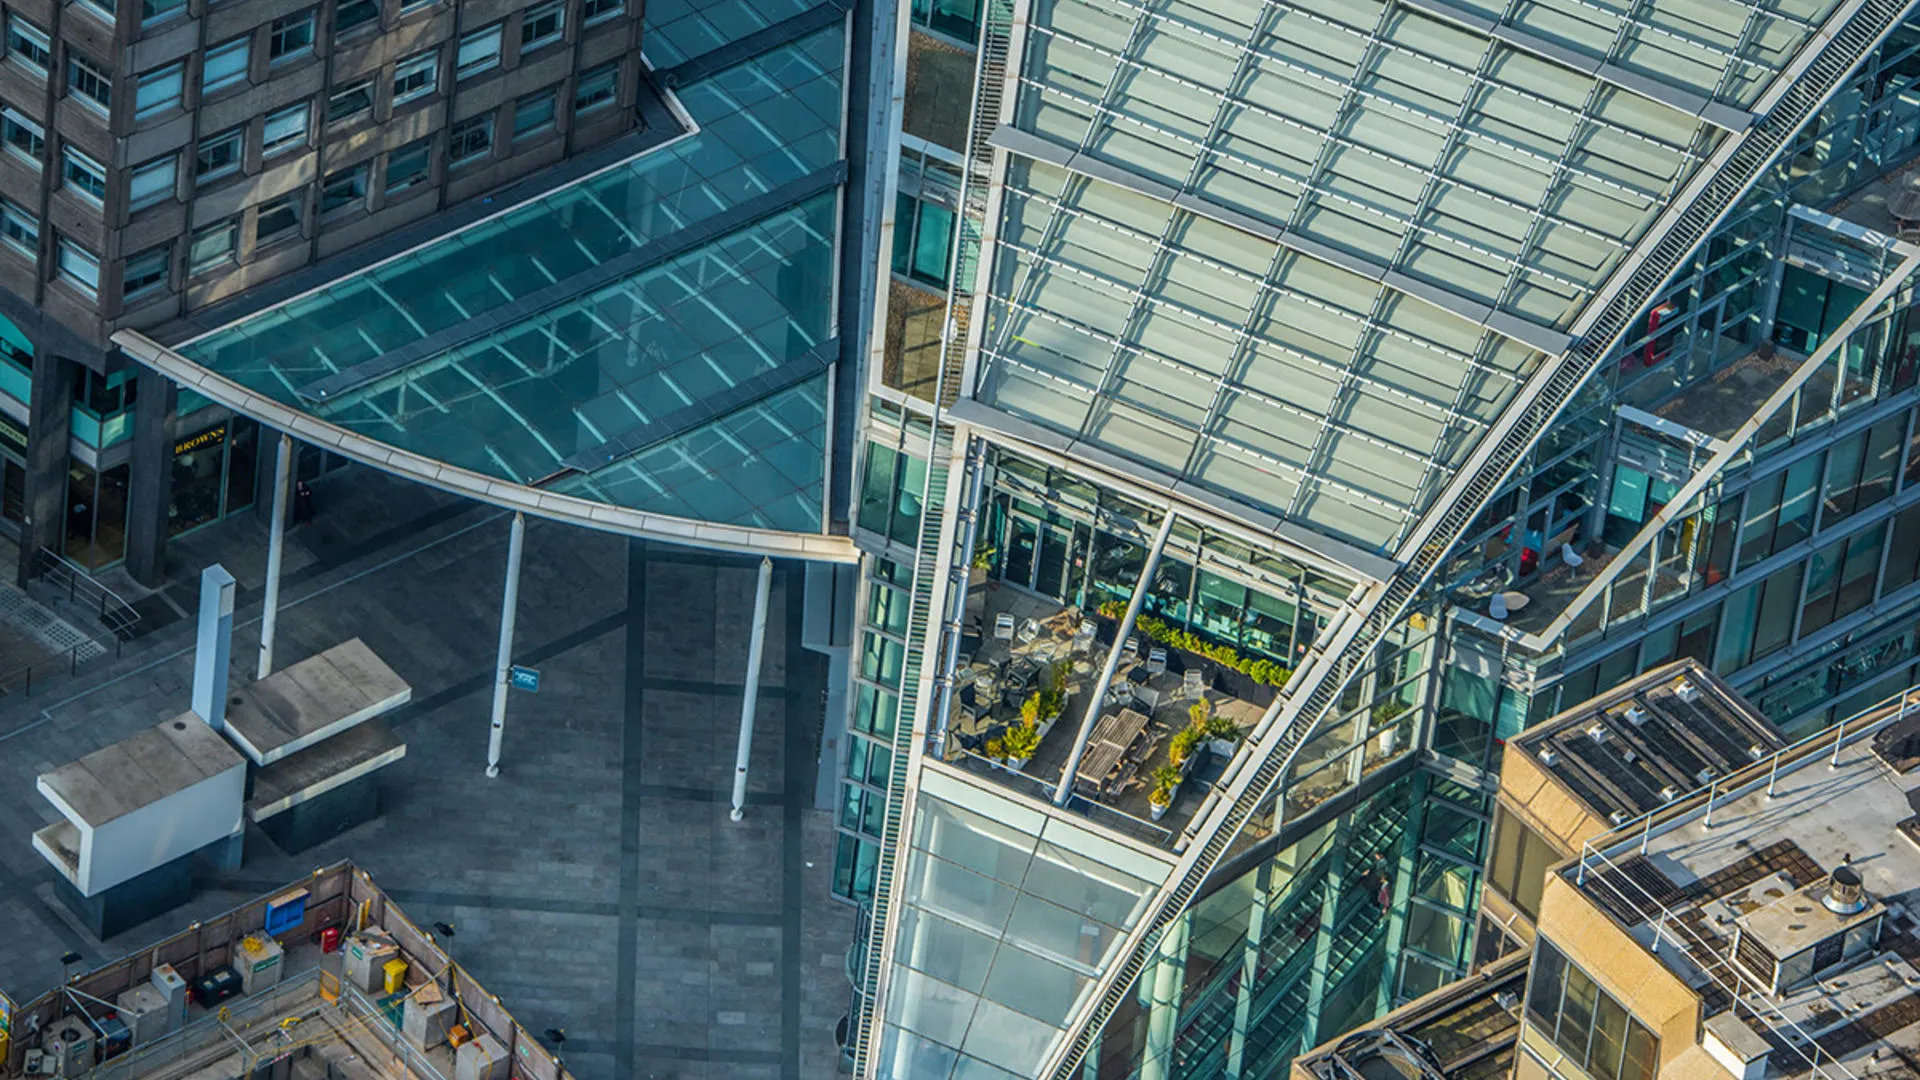
Landsec is built on places that stand the test of time.
We identify and shape places that create opportunity, enhance quality of life and bring joy to the people connected to them.
This is how we have created the UK’s leading portfolio of urban places.
Places where life happens. Where businesses grow. And where cities are defined
OUR LEADERSHIP
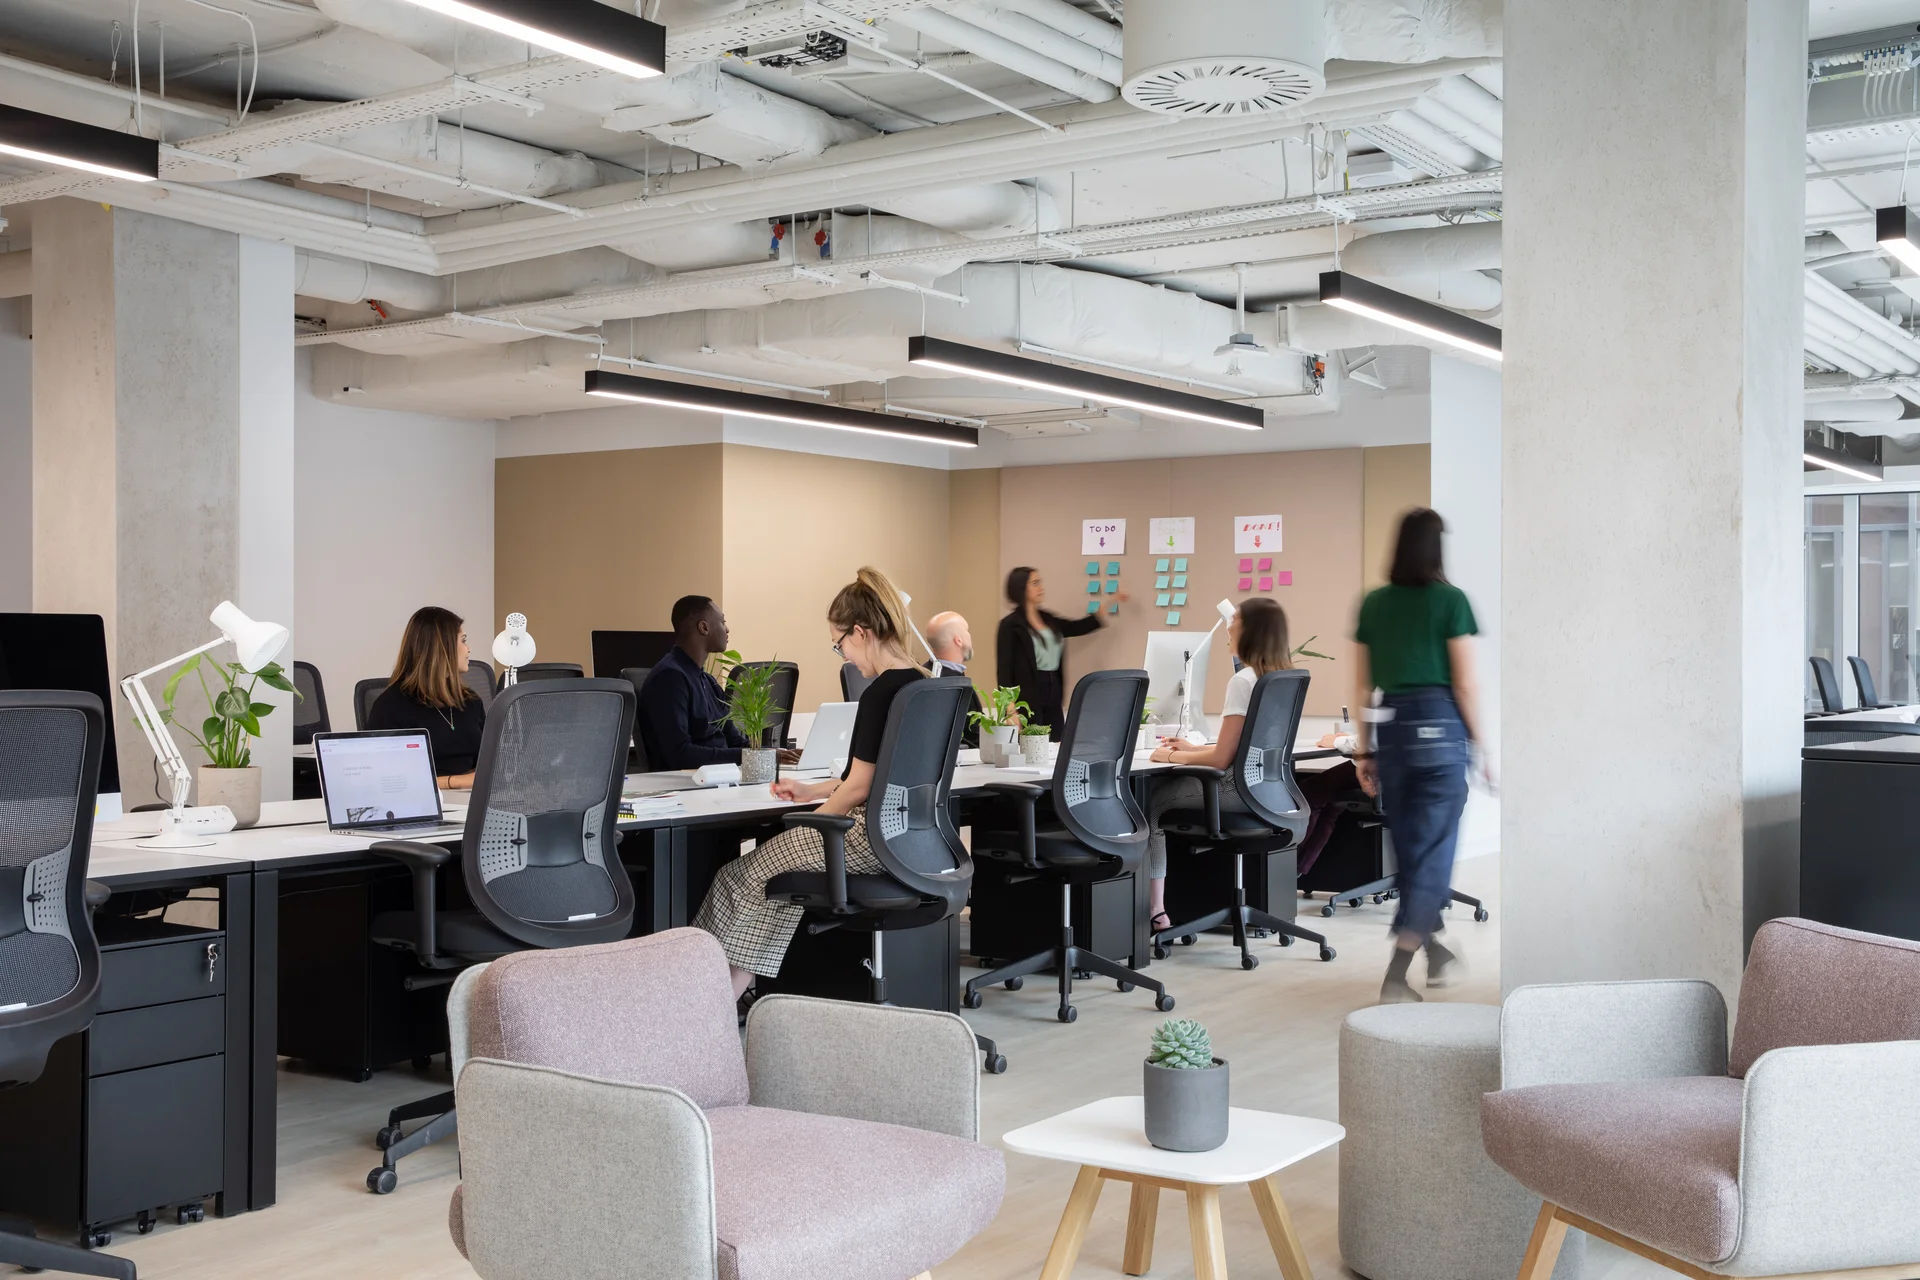
We draw upon the expertise, knowledge and varied backgrounds of our management to create the very best experiences for our customers, communities, partners and employees.
By getting that right we’re able to create long-term value for our shareholders.
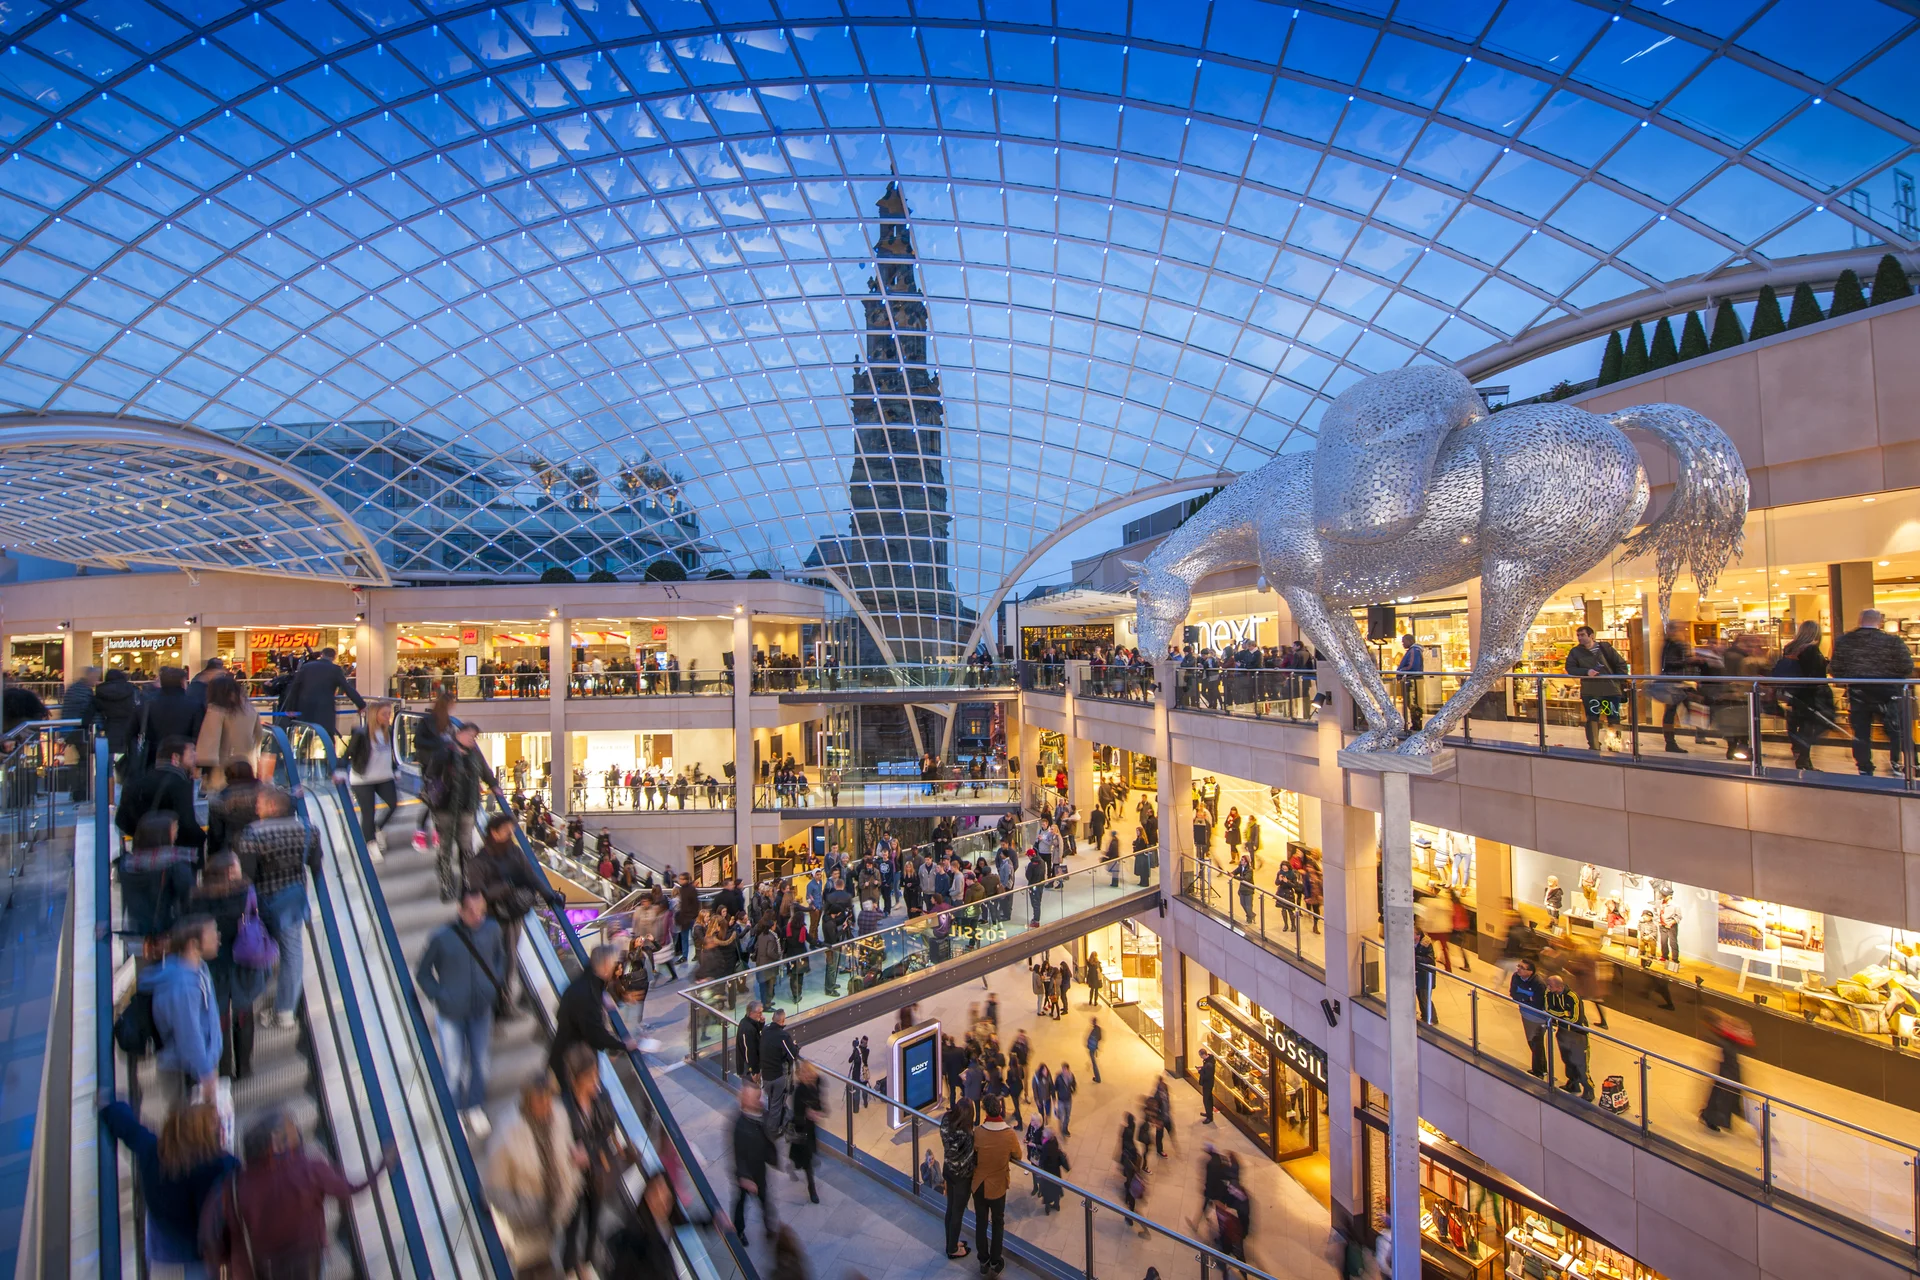
OUR PROPERTIES
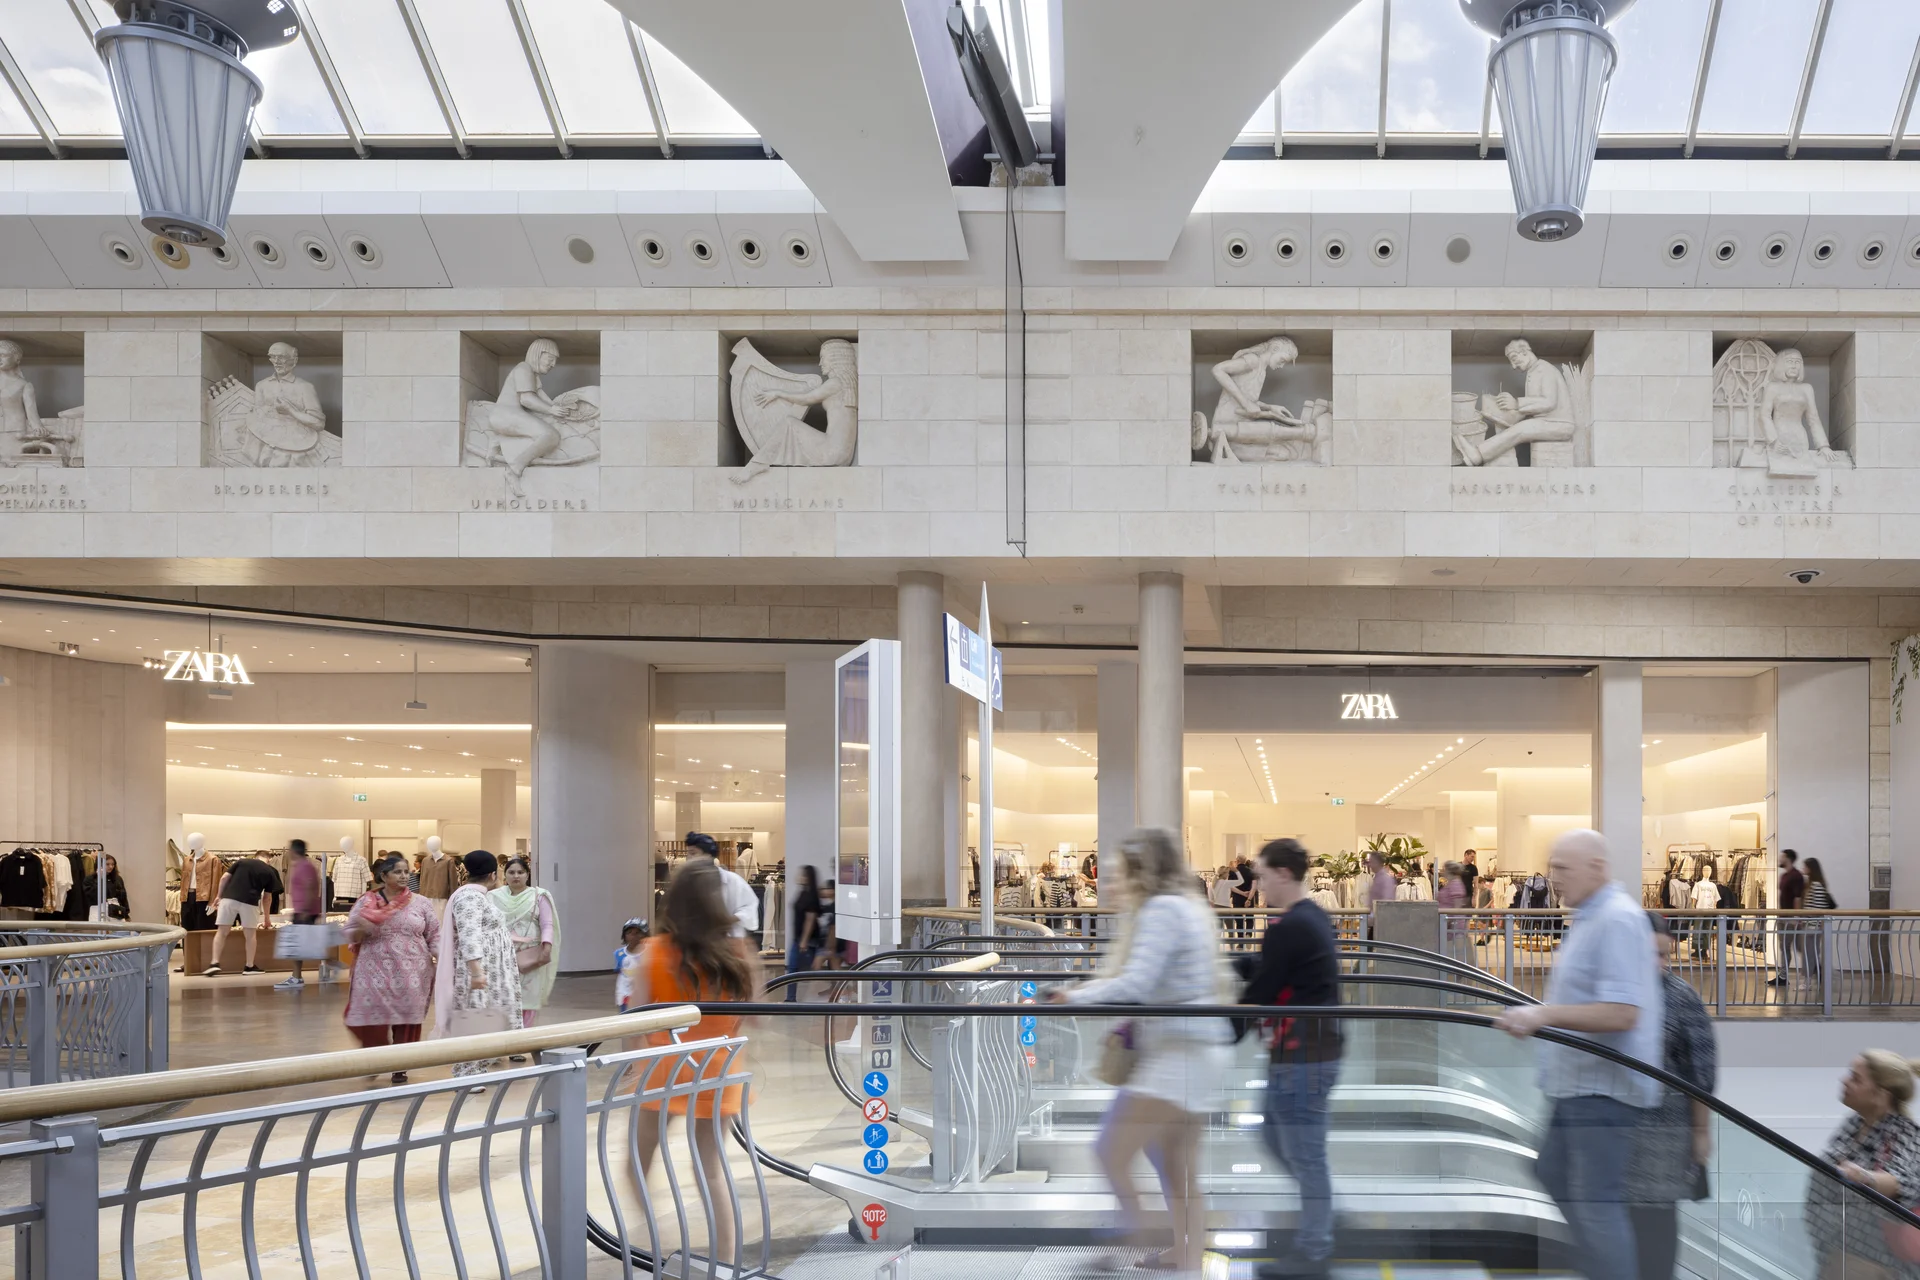
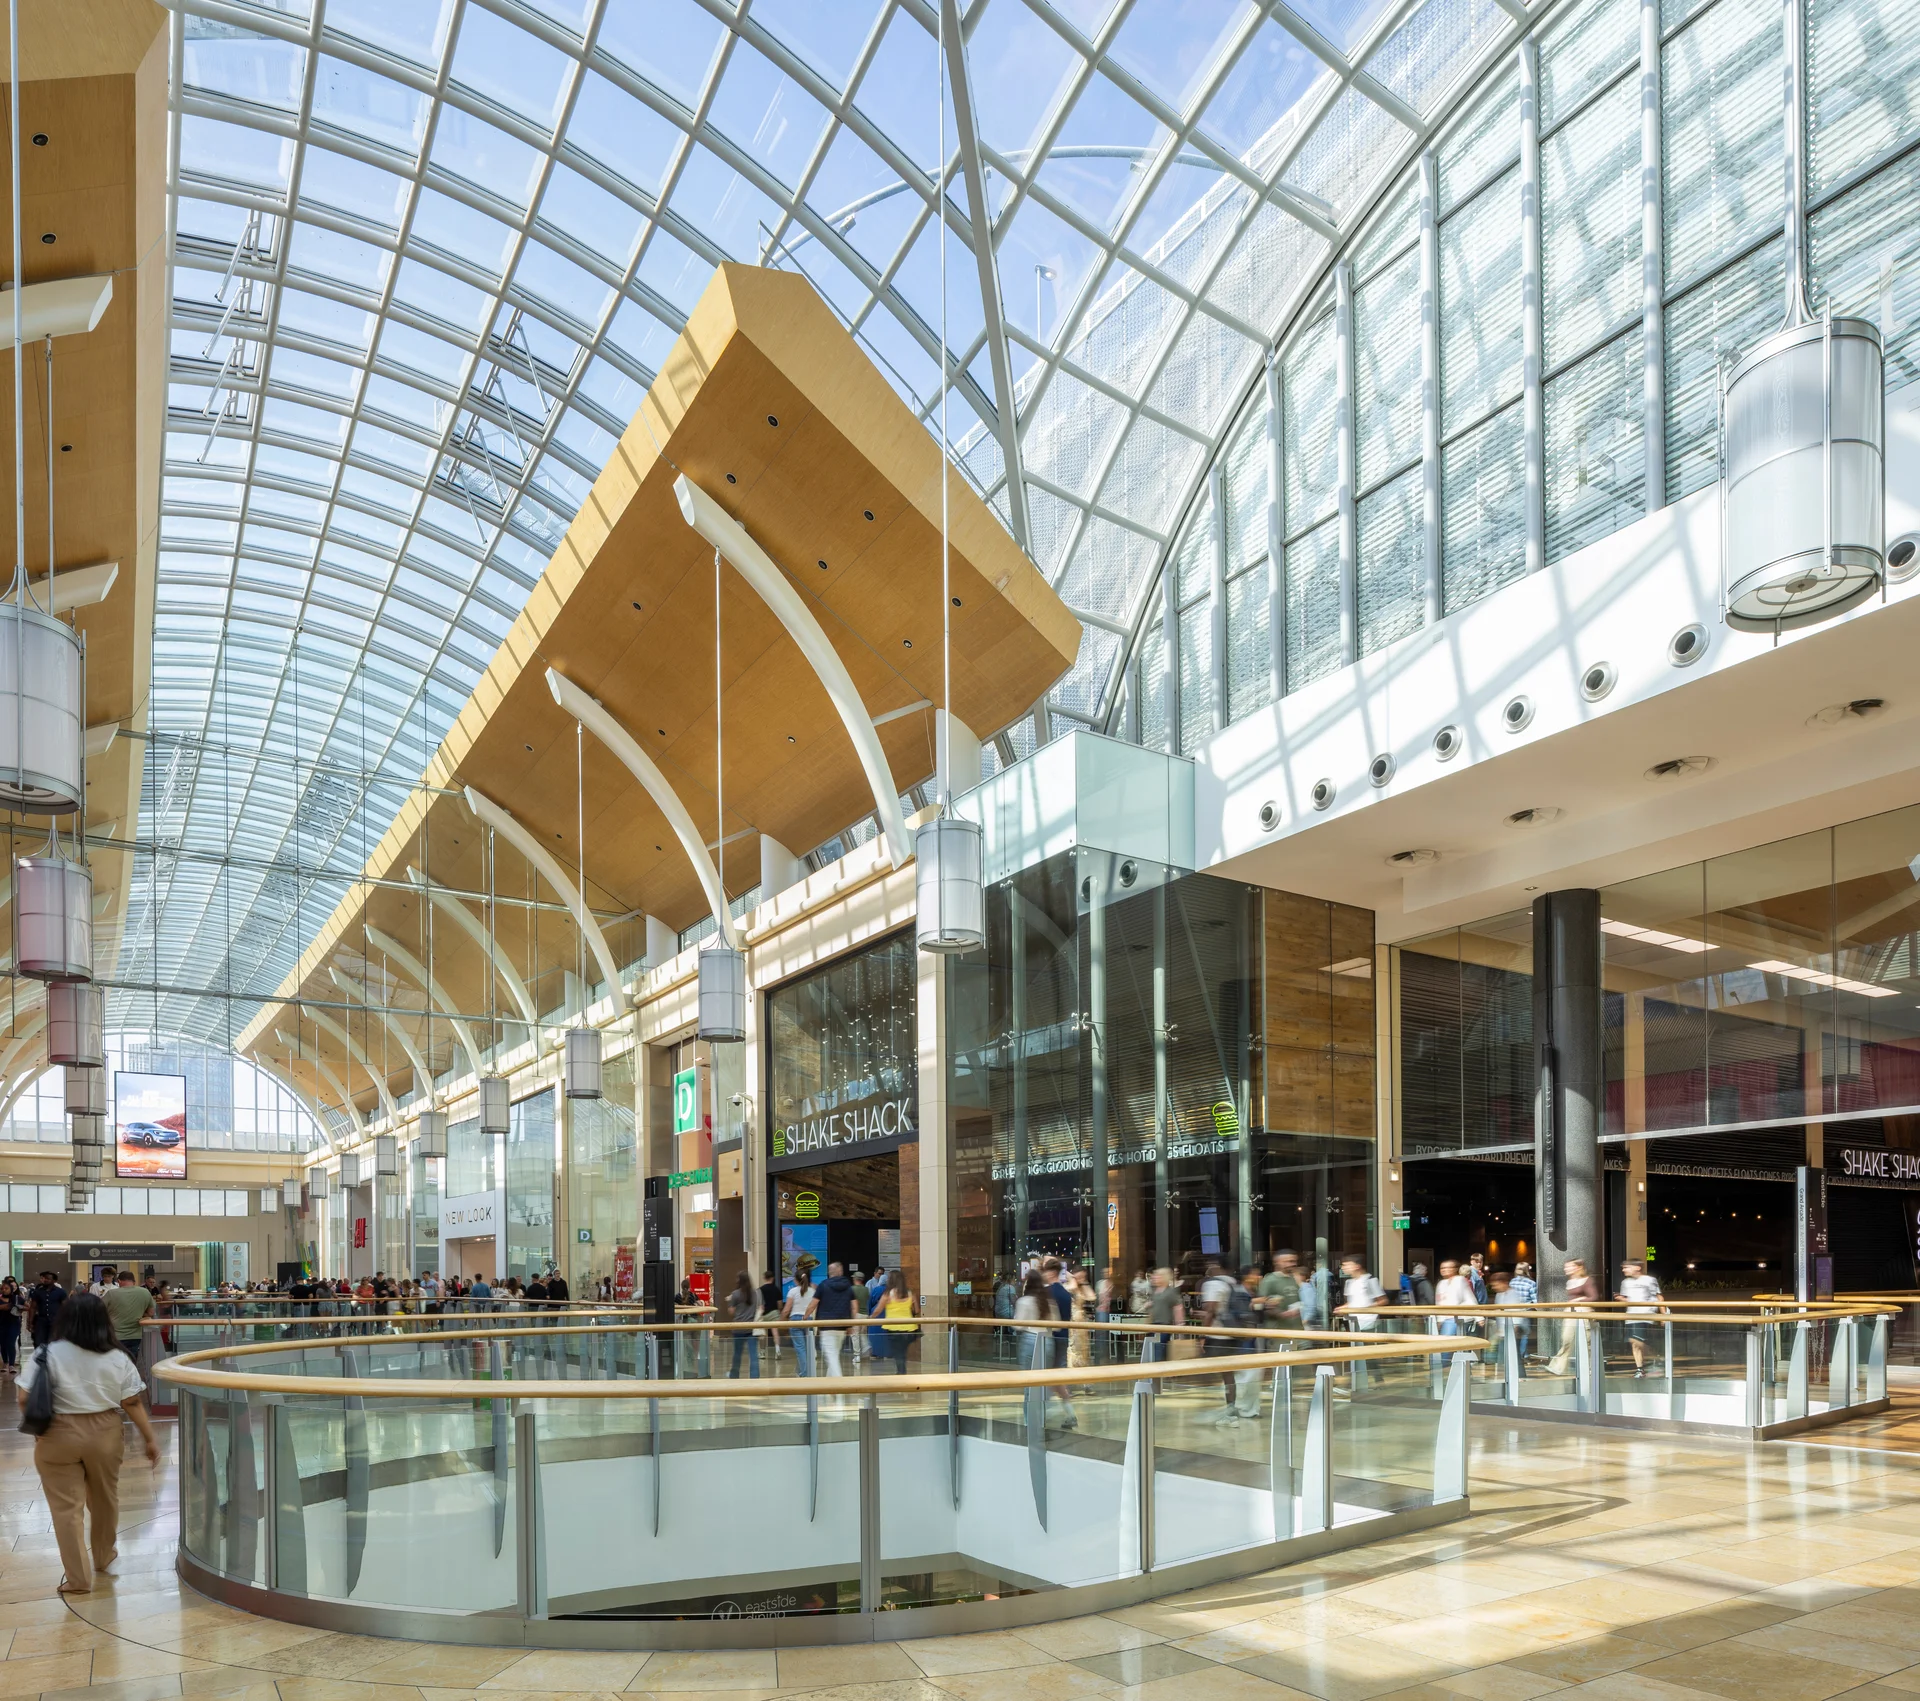
Bluewater, Kent
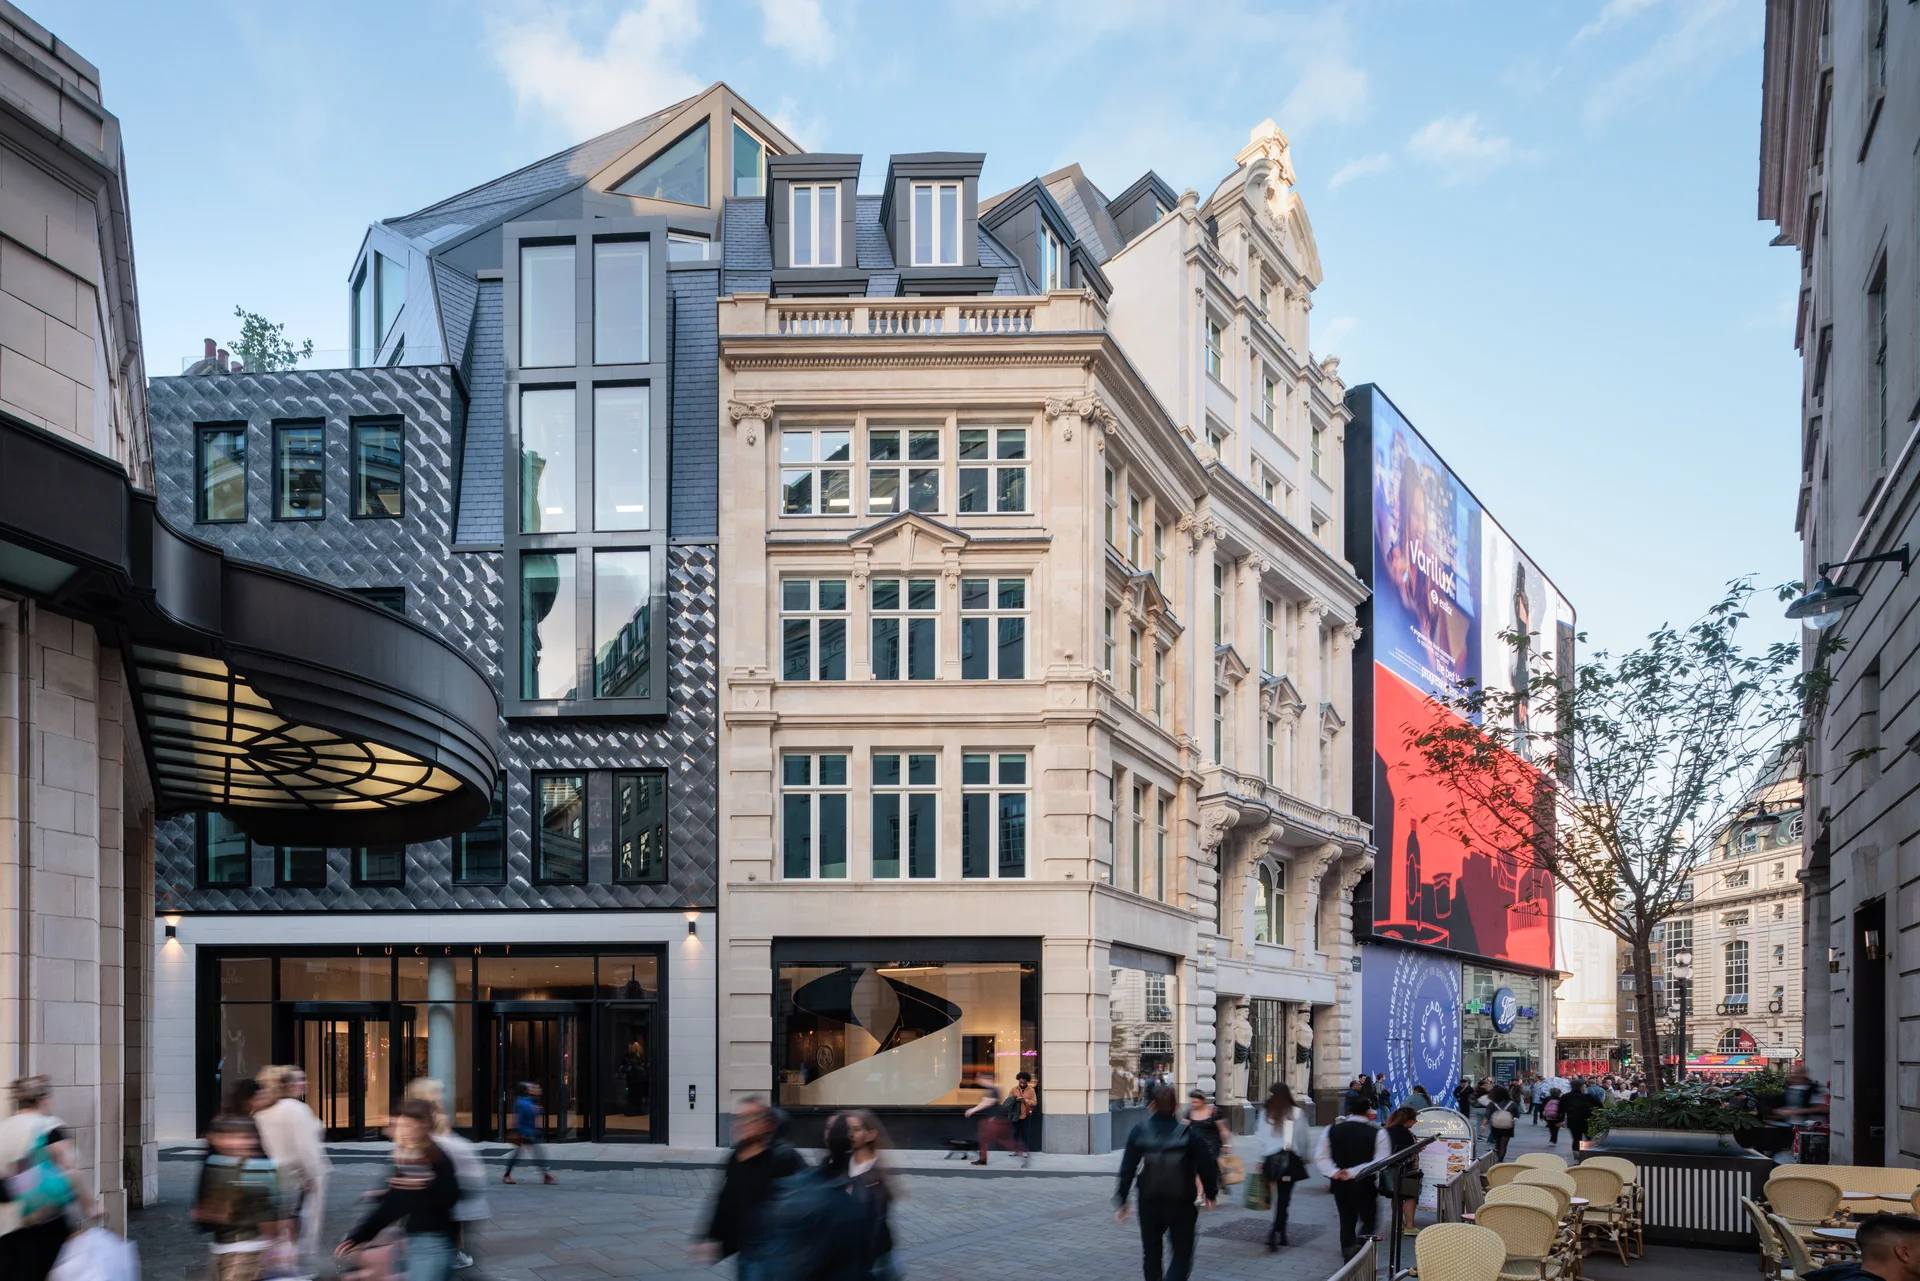
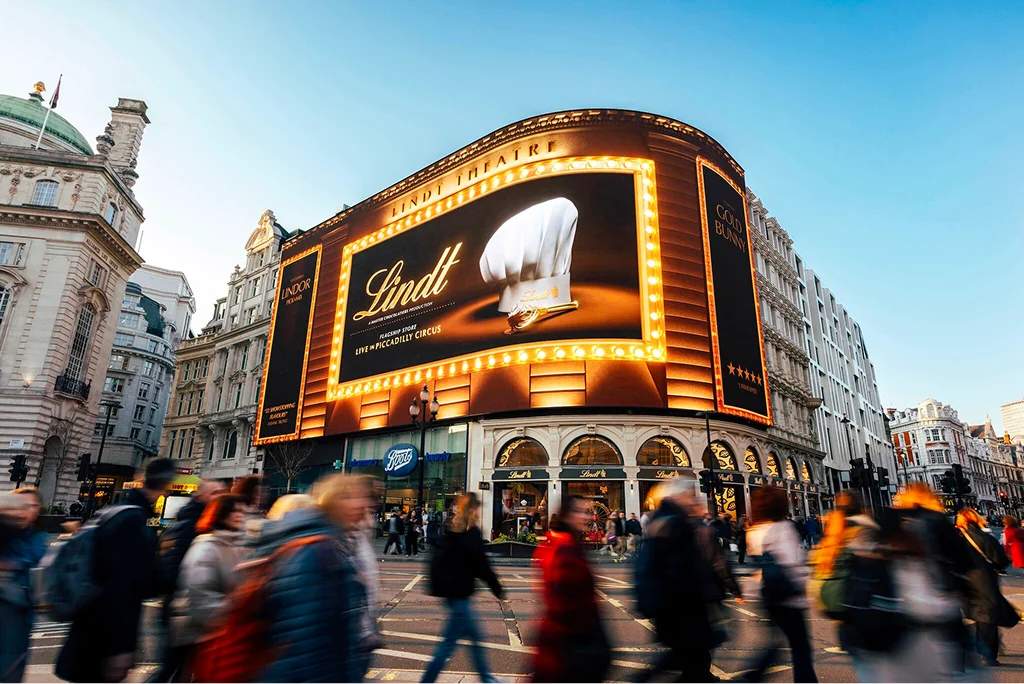
Lucent, London
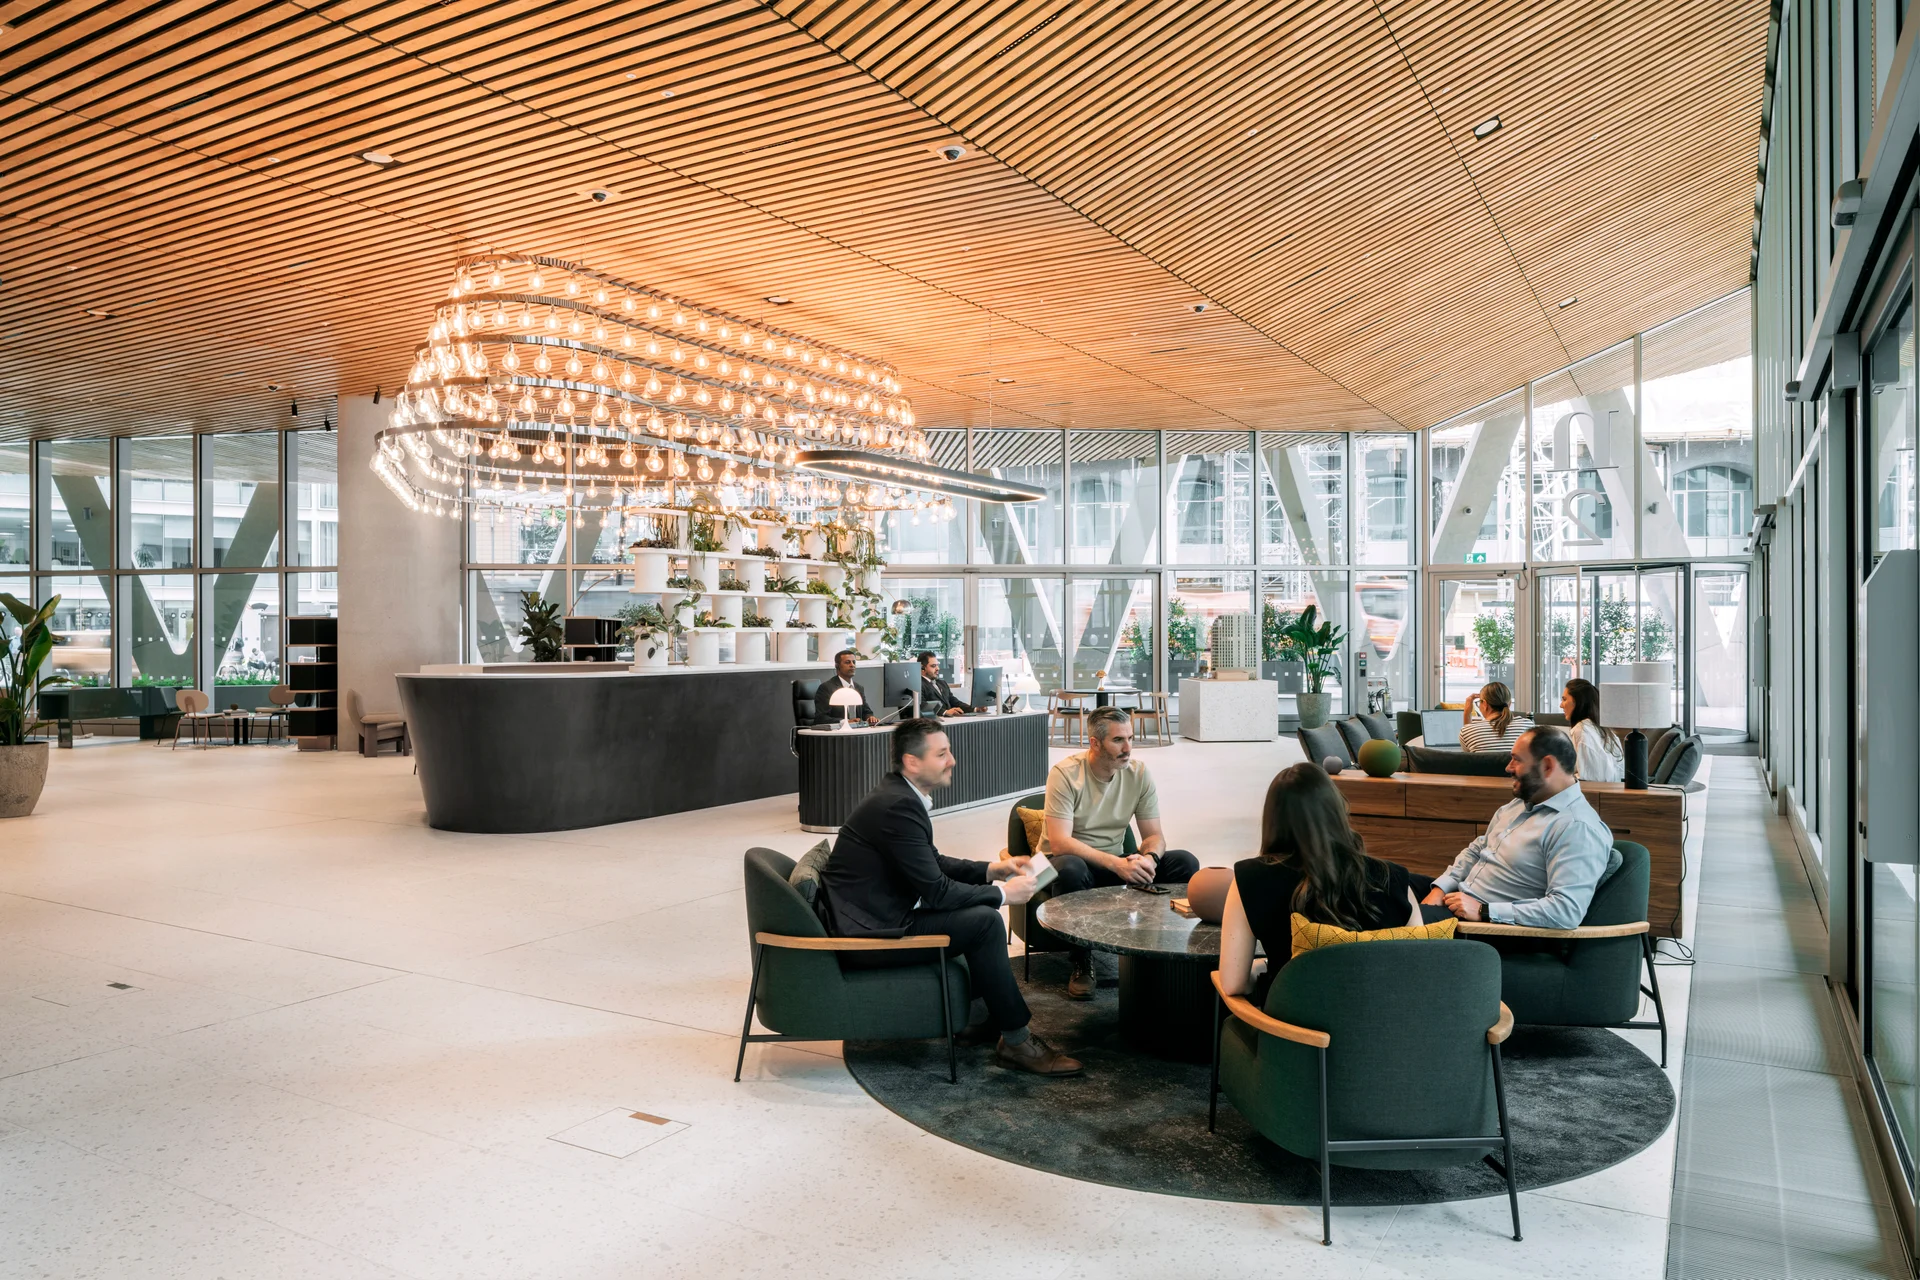
n2, London
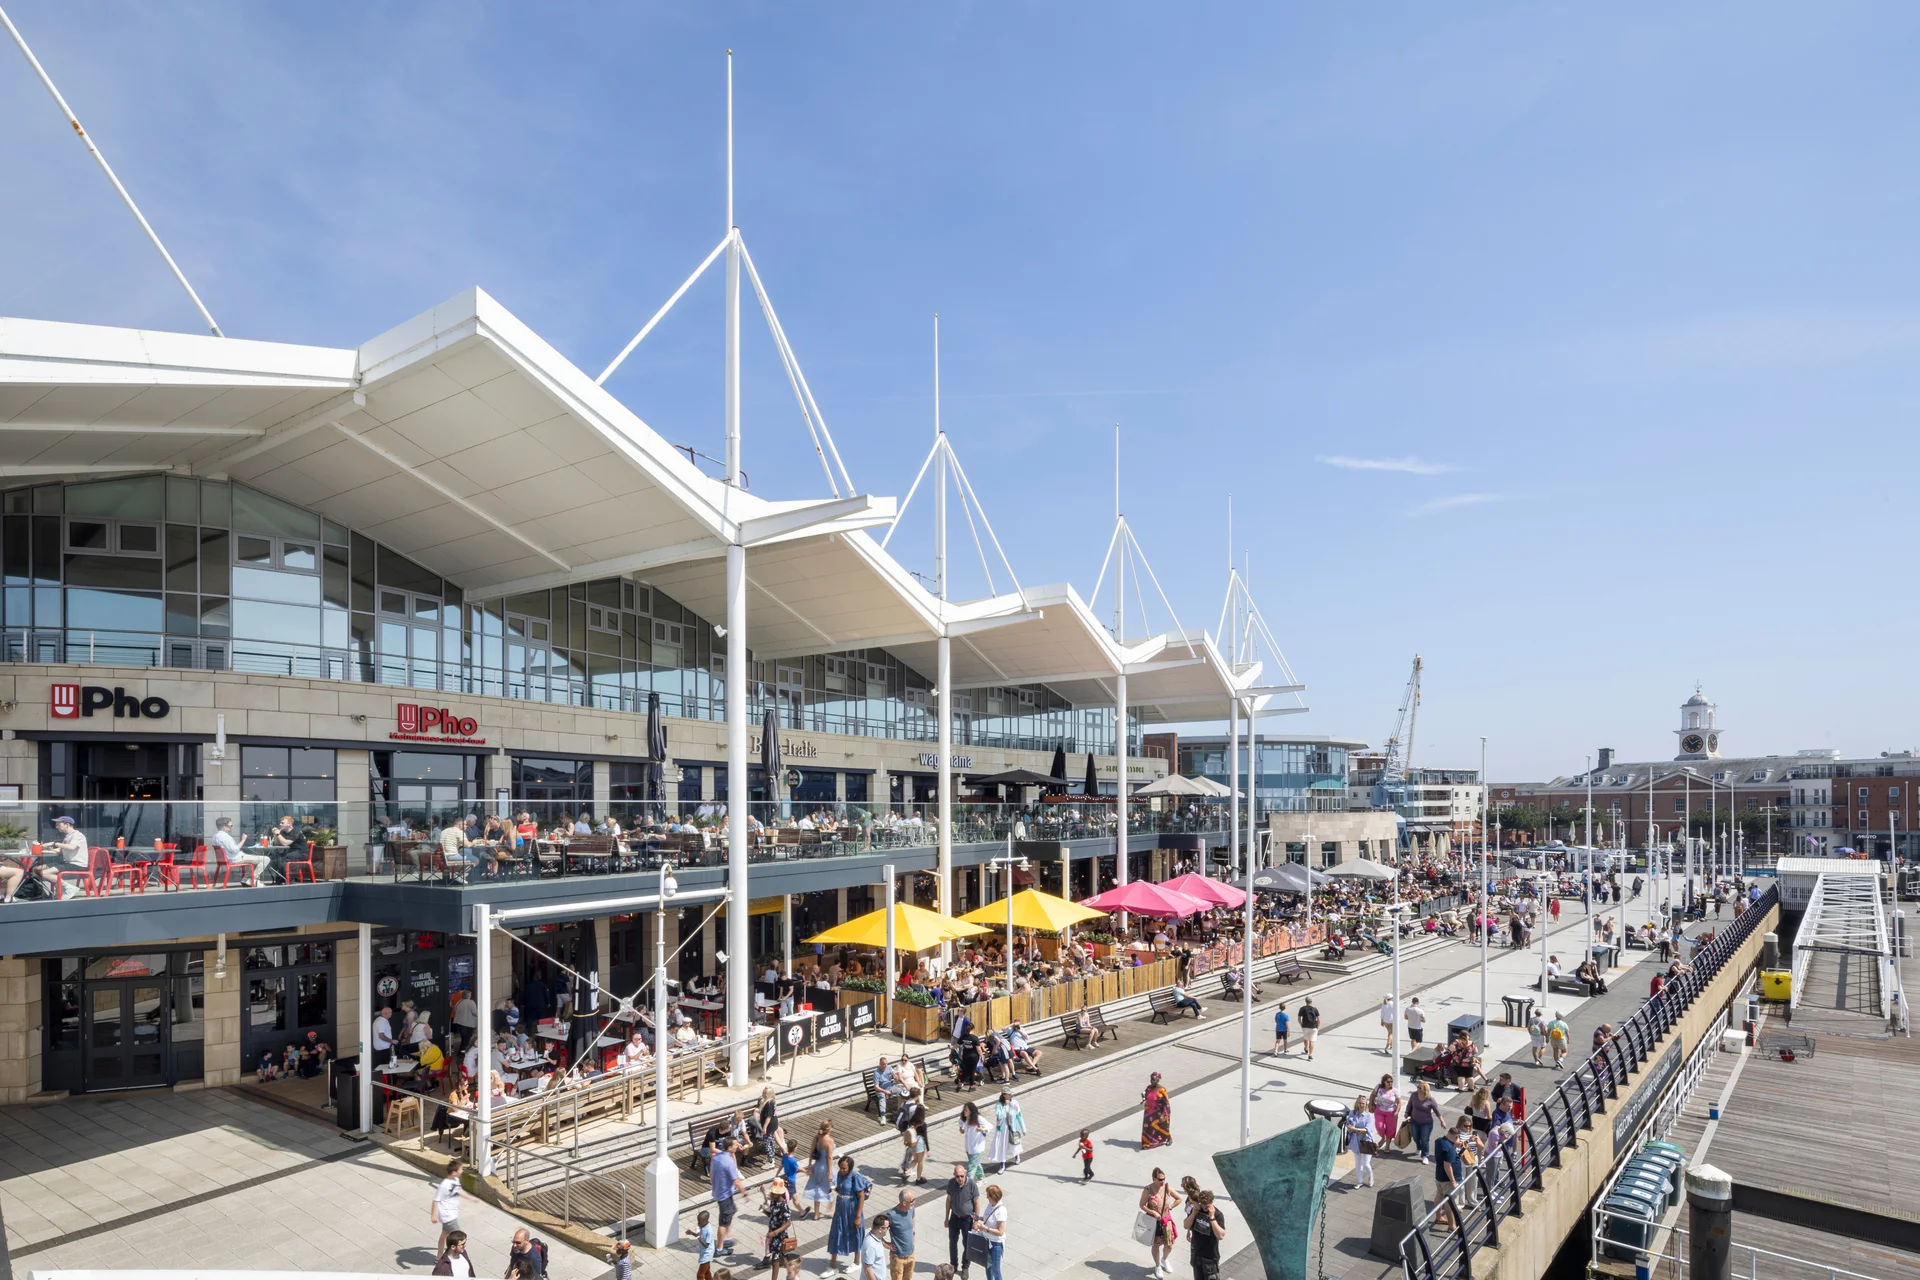
Gunwharf Quays, Portsmouth
St. David’s Dewi Sant, Cardiff
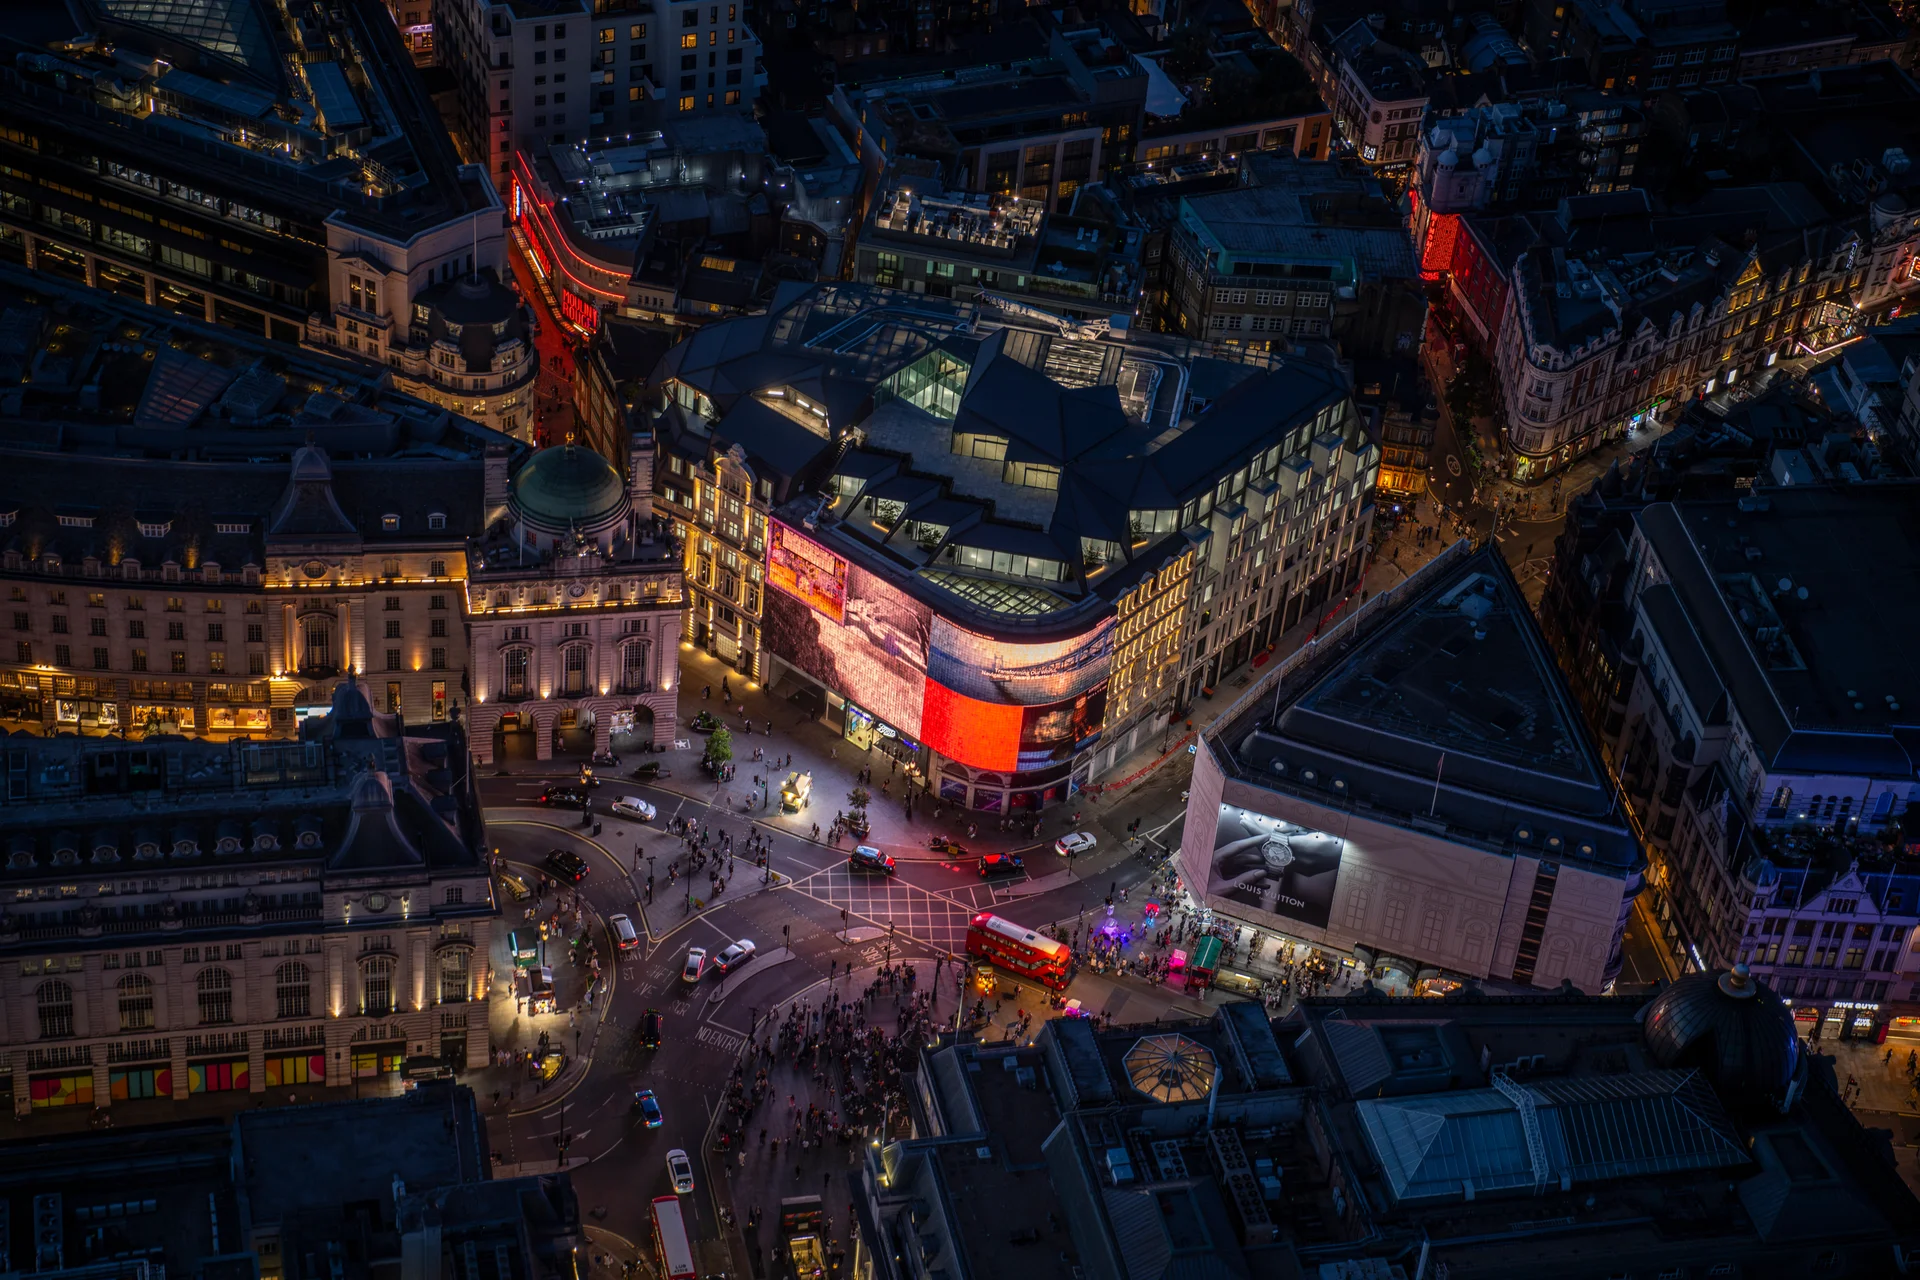
LANDSEC 80
Our story began in 1944, when Harold Samuel set up Land Securities, carrying out vital work to rebuild communities after World War Two.
Since then, we’ve continued to focus on acquiring places that will bring long-term value to our business, customers and communities.
It’s these places that have continued to evolve as the expectations of our customers, guests and communities have changed over time.
SHAPING PLACES
The kind of future we are creating takes purpose, re-imagination, collaboration and relentless creative energy to shape a world full of places that improve people’s lives.